SUCCESSFUL WEB MARKETING CAN IMPROVE YOUR BUSINESS PERFROMANCE
With the shift to a digital world, a company has endless opportunities to interact with their customers and learn more about how they behave and what they want to purchase. These numerous touch points can be confusing and overwhelming at times. However, understanding the opportunities to differentiate a company’s products and services through these touch points makes the effort worthwhile.
 A starting point in building a competitive advantage is understanding your website visitors – what they are looking for and how they are behaving. You need to know how your visitors interact with you across all channels – Organic, Paid Search, Social, Referral, Adwords, Email marketing, etc.
Even once you’ve compiled web engagement data, identifying actionable insight can be overwhelming. How often have your eyes glazed over looking at your Google Analytics (GA) account?
What is the answer – understanding begins with a question not numbers. The question formulates an assumption and your direction of inquiry. Assumptions can be turned into goals (KPIs) and then actions that can be tested and measured. Analyzing the resulting data from your changes can tell you whether your assumption was correct and if your actions delivered the desired outcome.
The DVA Web Reporting Service provides the basis for this questioning, testing, and measurement. In addition, the service assists in setting realistic goals (KPIs) and then it monitors performance to track the benefits realized. Reports enable comparison of current week’s activity to historic performance (12 weeks) to spot areas for improvements and the resulting gains in performance.
LEARN ABOUT YOUR WEB VISITORS FROM EVERY ANGLE
DVA Web Reporting Service takes GA clickstream data and describes your current visitor on-line activity in terms of:
- Where they came from
- Which referral sources were most effective
- What search terms were used
- What pages they visited
- How long they stayed
- Where they aborted the site
- What actions they took
- Which pages were most influential
- What content is most often viewed
- What conversions they made
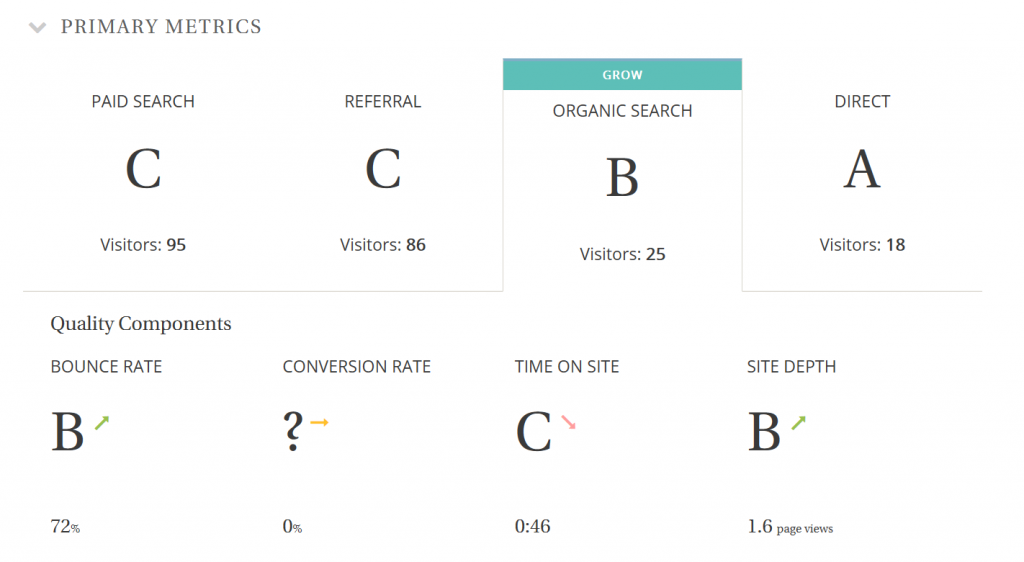
DVA presents the GA data in the form of “need to know” questions. For each question, the report shows traffic data and its corresponding engagement metrics for the current week and 12 weeks of history. One of the questions used is Where did my traffic come from last week? This report shows, for each channel, its visitor traffic, engagement metrics (bounce rate, time on site, conversion rate, etc.), and Grades. Grades reflect how the channel is performing against recent history.
Qualitative analysis is what really is special about DVA reports. Because we analyze web traffic over both the short and long terms, Grades reflect current performance in the context of the site’s norm. As a result, the Grades are less susceptible to influence by a good day or a sudden drop in visitor traffic. This approach minimizes misleading insights and uncalled for actions such as growing or optimizing the wrong channel.
VISITOR ACTIVITY AND ENGAGEMENT GRADES USED TO IDENTIFY ACTIONS
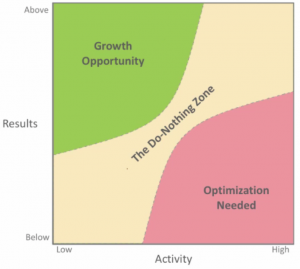 By using activity and Channel Grades, you can identify plausible opportunities for growth or optimization. As illustrated in the diagram, there are three possible actions based on where a channel falls on the axes. For channels with significant visitor volume (High on the Activity scale) but a low Grade (Below on the Results scale) – pink area, the action would be to first optimize website performance and then continue to grow the traffic. In the case of a high performing channel – high Grade (Above on the Results scale) but low visitor traffic (Low on the Activity scale) – green area, the action would be to grow the audience. For channels that fall in between, no action would be taken. Channels with both low quality and volume (lower left corner) may not be worth the time and effort. Those in the upper right hand corner are already at full capacity and performing well.
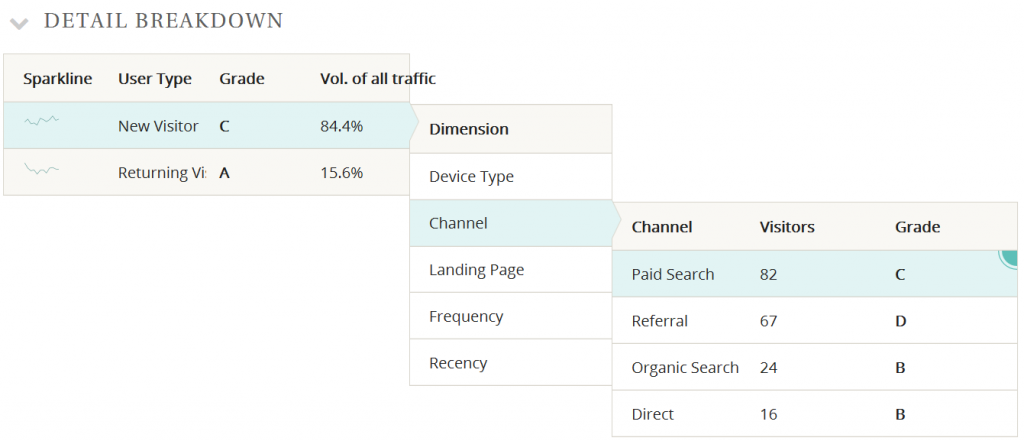
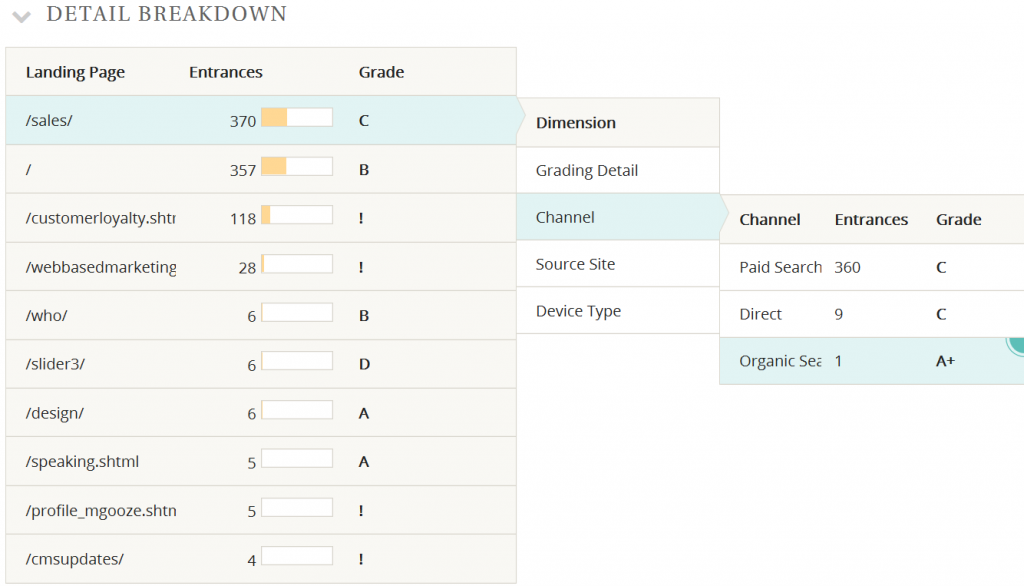
Different report questions can also be used to find additional aspects of your visitors relationship to your site. In the example below, the Organic Search Channel averaged a Grade of B but resulted in only 25 visitors out of a total of 224. The majority of these visitors were new to the site. The landing page analysis shows that /sales was the most influential page but not for Organic Search thus vastly underperforming Paid Search in terms of effectiveness. The reports point out the need for some search engine optimization, adding more relevant content and possible additional inbound links. The different questions and their corresponding report illustrations are shown below:
Q: Where did my traffic come from last week?
Q: Am I attracting both new and return visitors to my website?
Q: What are my top landing pages?
To assist in attaining results from your actions, the reporting service can calculate a reasonable goal (KPI) based on recent performance, the variability and volatility of a channel’s traffic. Once the goal (KPI) is selected, the service monitors the channel’s performance against the goal over the next three months. The goal setting is available for most reports except when averages are impossible to calculate because of outliers.
HOW TO PROCEED WITH THE SERVICE AND WHAT REPORTS ARE AVAILABLE?
To get started, think about the questions you’d most like answered and find the report that fits. The reporting service will deliver the reports automatically each week or month. A complete list of available reports are contained in the DVA Web Reports Guide (click the link below to request a copy). All reports are meant to work in concert providing a more complete picture of your visitors versus just faceless hits on your website.
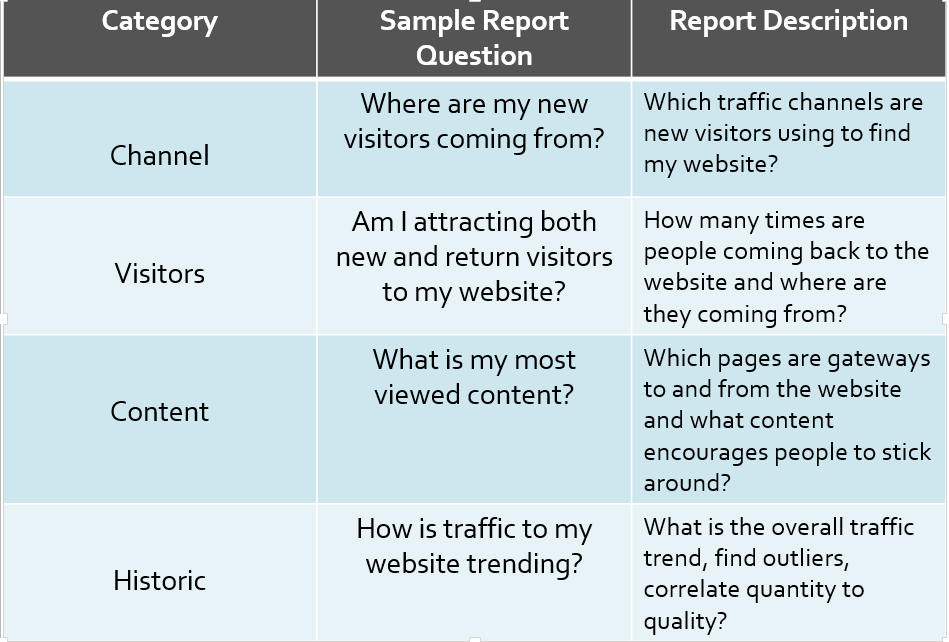
The following tables lists some of the reports produced by DVA (currently 31 reports in total). The tables detail report categories, questions and descriptions.
Standard Reports (most websites)
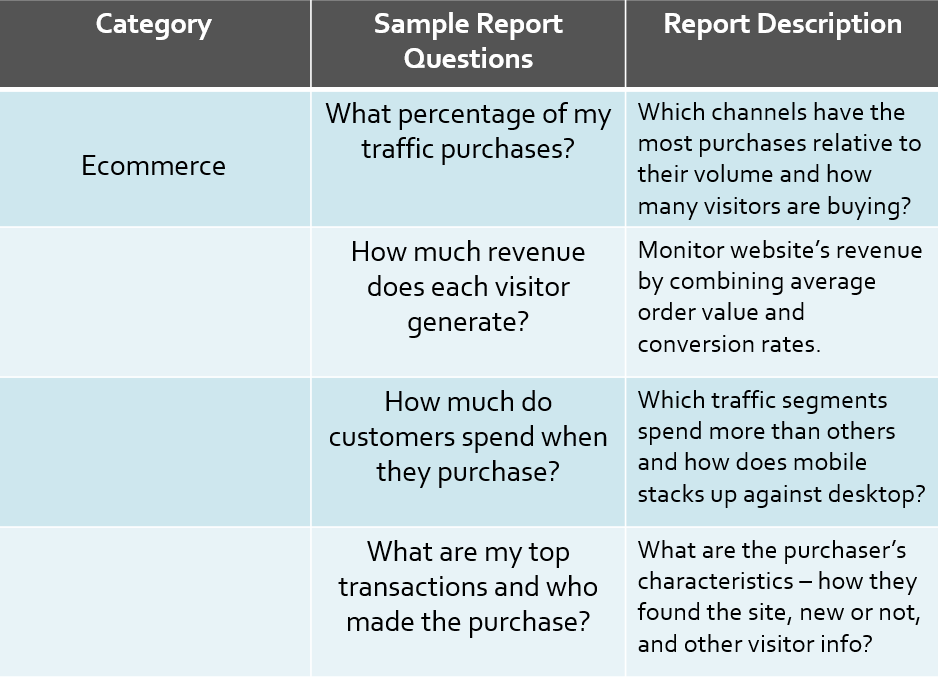
Ecommerce Reports
Using the reporting service enables the marketer to make real time adjustment where funds are being spent. Using reports like How are my Adwords Campaigns performing?, you can monitor performance and see immediately what is working and what is not. Savings can be realized by reallocating funds to marketing campaigns that are working.
IMPROVE WEBSITE PERFORMANCE
 The information contained in DVA’s Web Reporting Service can be invaluable in understanding how to change your site to realize the desired visitor response. In addition, the decisions to increase or reallocate marketing expenditures aimed at improving site traffic, performance metrics and revenues will be based on reported facts, sound analysis, and realistic goals calculated by the service. So, if your company is experiencing any of the following conditions, our reporting service is designed to help:
- Unstable or decreasing Website traffic
- Paid marketing budget not delivering desired results
- Social following is low
- SEO strategy not working
- AdWords campaign CostPerSalesDollar is too high
- Sales targets are not being achieved
For additional information about the service, please click below to Request a Copy of DVA’s Web Reports Guide.
Digital Marketing Strategy Review
In addition to our reporting capabilities, DVA is available to review your current strategy based on the information and trends observed in our reporting service. While understanding how your website is performing is a critical first step, enhancing web interaction data with information from your advertising, product and customer relationship management systems rounds out the picture.
We can also aid in other aspects of Digital Marketing including Link Building and Content Marketing, SEO Strategies, Keyword Research, Competitor Analysis, Content Research and Campaign/Account Reviews.
With DVA‘s Tableau Dashboard capabilities, we can integrate all of this data into a custom build reporting tool that generates a complete digital marketing solution.