HOW IMPORTANT ARE YOUR CUSTOMERS TO YOU?
How important are your customers to you? Silly question or is it?
Harvard Business Review stated the average business loses 50% of their cutomers every five years!
Is it better to retain current customers or keep adding new ones? Sales growth is most important or is it?
 The book Leading on the Edge of Chaos sheds some light on this important distinction:
- Acquiring new customers may cost as much as 5x more than retaining current customers
- 2% increase in customer retention has the same effect as decreasing costs by 10%
- Reducing customer defection rate by 5% can increase profitability by 25 to 125%, depending on the industry
- Customer profitability tends to increase over the life of the retained customer
Do you have the tools to make customer retention easier? The following explanations and analysis should help.
HOW TO MAKE CUSTOMER RETENTION EASIER?
The analysis that follows illustrates the use of Tableau in visually analyzing the factors that lead to customers terminating their cellular service. The example and data represent approximately 32,000 customer records of a fictitious company experiencing very high turnover rate (customers discontinuing service). The images below taken from the Construction of the Tableau Dashboard highlight the analysis performed in arriving at the key metrics (KPIs) and characteristics associated with customers cancelling their service. In addition to the images, the following provides some key steps and explanations of what will be seen in the Tableau workbook.
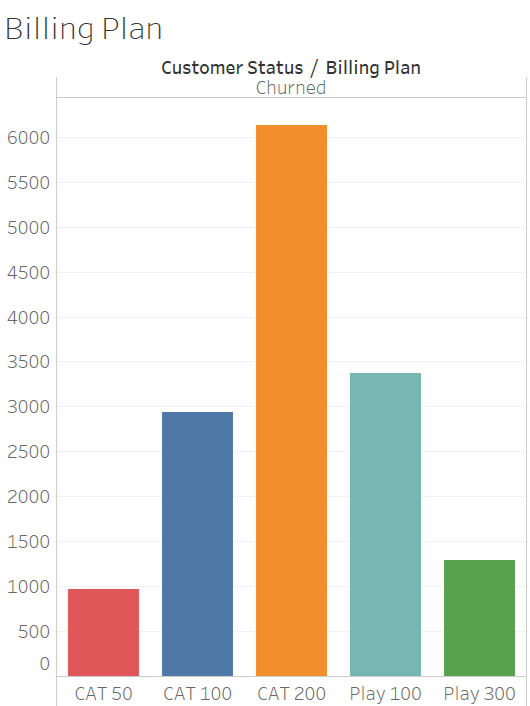
Steps taken to identify the Billing Plans most commonly used by those customers terminating service:
- Connect to Customer data
- Pull data elements onto the Tableau canvas
- Sort customer data by those terminating service
- Display visually the breakdown of the number of customers terminating by Billing Plan (CAT 200 has the largest number of customers)
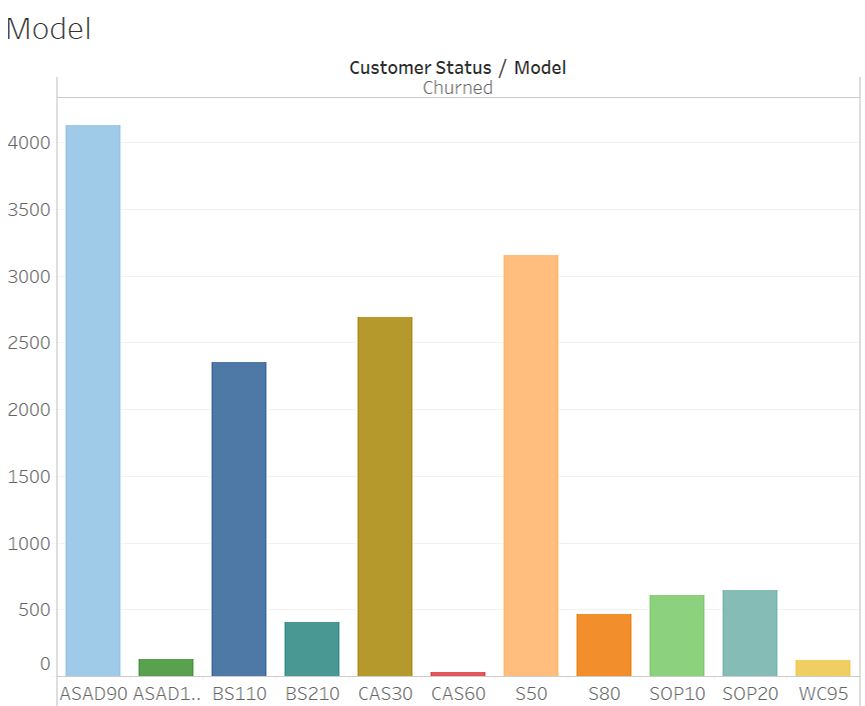
Steps taken to identify the phone Models most commonly used by those customers terminating service:
- Sort customer data by those terminating service
- Match terminating customers by their phone Model
- Display visually the breakdown of the number of customers terminating by Model (ASAD90 model used by largest number of these customers)
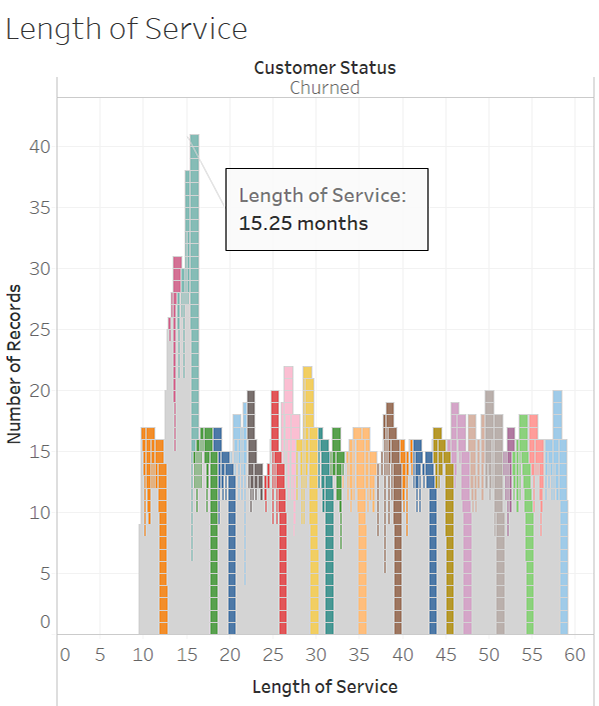
Steps identifying customers cancelling by their Length of Service:
- Display customers based on the number of service months before cancellation
- Observe largest number of customers terminating had service for 15 months or less
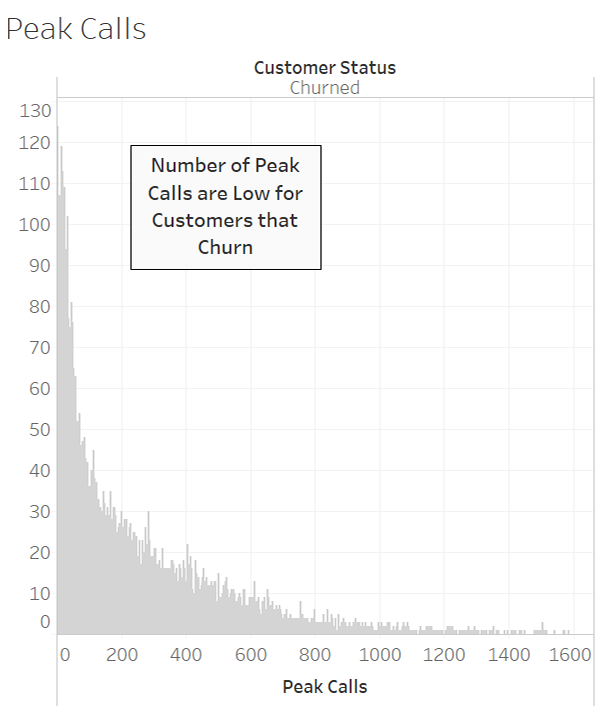
Steps analyzing number of call associated with peak usage:
- Display the distribution of Peak Calls by the number of customers terminating service
- Observe the vast majority of terminating customers profiled had relatively small usage up to termination
Steps analyzing number of calls associated with National Minutes:
- Display the distribution of National Minutes by the number of customers terminating service
- Observe the distribution is widely disbursed with little evidence of any pattern indicating a particular usage level that is more common than any other (lower usage is more prone to cancellation)

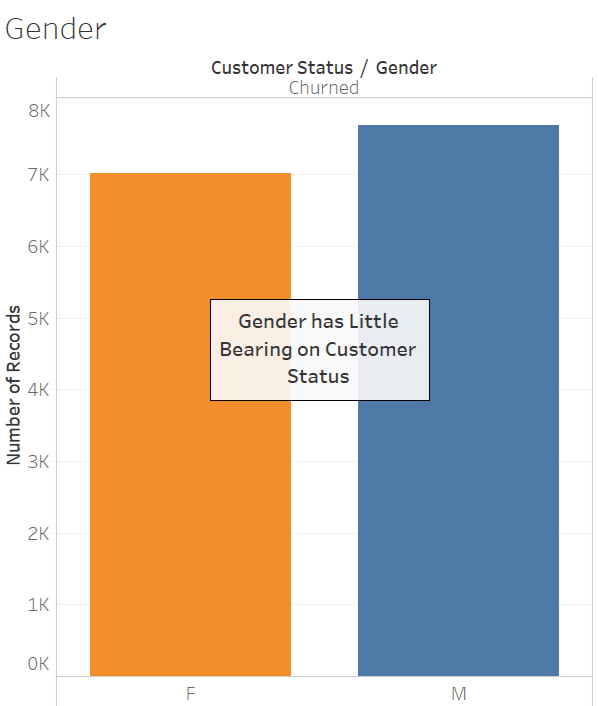
Steps taken to test a number of other customer characteristics:
- Display customers terminating by their gender
- Observe little difference between male and female in terms of which have canceled service
- Test other customer characteristics (age, income, geographic location, etc. had little relationship to customers terminating)
Combining findings from previous analyses helps to identify customers prone to cancellation:
- Combine multiple tests using Clustering algorithm to test for commonality (identify customers more related to each other than others based on some characteristics)
- Study patterns from numerous combinations (CAT 200 Billing Plan and ASAD90 Phone Model were the factors most common among customers cancelling their service)
- Observing other factors can act as additional warning flags such as low levels of Peak Calls, short duration of service and high levels of dropped calls

INCREASE CUSTOMER RETENTION
Using the results for this Customer Retention Analysis, the company could improve customer retention using this plan of action:

- Categorize existing customers into groups based on their Billing Plan and Phone Model profiles and total customer billings
- Factor in current phone usage, time in service and level of dropped calls to identify high risk customers
- Contact these high risk customers to build customer relations by offering a customer survey
- Offer incentives to continue service based on survey results and customer’s value to the company
- Monitor plan against future cancellations to see if improved retention resulted
Each company’s circumstances are different. The point is being proactive in terms of improving customer retention by analyzing current experiences versus established KPIs and making concerted efforts to address any issues and needs.