We Aim to solve business needs with Data Visual Analysis
Data Visual Analysis Group (DVA) is a professional consulting firm that offers an alternative to the traditional spreadsheets and Business Intelligence (BI) tools and approaches. Spreadsheets and most existing BI tools have failed to meet the needs of business professionals. Spreadsheets tend not to be a company-wide information delivery system, but are unique to the individuals that built them. Companies have many spreadsheets with different views of the business resulting from inconsistent definitions of business elements and metrics.
When BI tools are used, they are mostly designed for report generation supplied by a team of highly trained analysts. Instead of providing the business user with flexibility, these reports are often rigid in structure, limited in their scope and capabilities and can take months and even years to set-up. They fail to engage the mobile workforce and underutilize all available company and outside data.
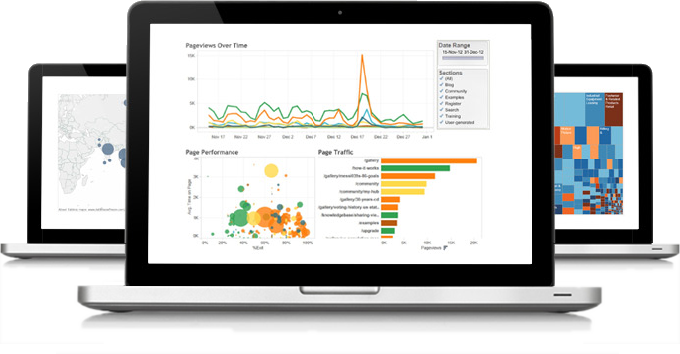
In contrast, DVA uses software from Tableau that enables us to build workbooks and dashboards that provide data visualizations. Unlike static charts and graphs, visual analytics is interactive; namely, the user can interrogate the data and repaint the resulting picture with a click. Instead of the chart showing the conclusion, visual analytics enables the user to ask a question of the data, get an answer, and ask follow-up questions rapidly all within the same visual interface without assistance from a technical resource.
 The user of the visualizations can perform a number of analysis and investigative routines including instant data calculations, drill-downs to the underlying transactional records, and geographic and spacial representations of the data. As a result of DVA’s building these visual analyses, the investigate “story” unfolds before your very eyes. These stories can be retained in workbooks or shared with others via mobile devices and across the Internet.
DVA has a simple mission: help people to use advanced visualization tools to understand their data better. Joined by other world-class practitioners, we have used Tableau, Alteryx, and other support software applications to accomplish amazing things. DVA has access to some of the most brilliant independent software masters in the field of data visualization anywhere outside of the major software vendors. Collectively we are addressing one of the most challenging problems in business analysis: making disparate data contained in databases, spreadsheets, business applications, and the Internet visually usable and actionable for the business community.
Leadership
Creig FosterCEO & Founder

Creig Foster founded DVA as an outgrowth of his parent company, Analytics Consulting Group (www.analyticsconsultinggroup.com), to offer specialized data visualization and analysis consulting services. In addition to technical skills, his background includes consulting experience in most business areas including sales, marketing and finance.
He has had the privilege of providing business consulting and decision support to senior decision-makers both in industry and health care for over 25 years. During the years working for clients of some of the largest consulting firms in the country, he has found three truths to be common:
- Many problems or decisions facing the organizations are important and out of the ordinary; prior experience may not help.
- The impact of any of these decisions affects multiple players and each player has his/her own perspective of a possible solution and each has competing resource demands.
- The need for help is clear given the nature of the available information being poorly organized, in multiple silos, and inadequately analyzed.
While basic consulting and analytical skills are important, Creig has found polite persistence and a good amount of common sense goes a long way in dealing with these complicated and interpersonal decision events.
Creig is one of a select number of professionals that has combined his practical corporate experience with the use of advanced business analytics – data mining, statistics, data visualization, and predictive modeling to help companies solve their unique business problems, enhance management’s decision making process, and install on-going performance measurements.
